Most store owners think about their POS system as the machine that takes payments. Someone walks to the counter, taps a card, maybe signs a receipt, and the sale is done. That’s usually the main thing people notice.
But behind the scenes, something else is happening.
Every checkout creates small bits of information. Product names, prices, time of sale, payment method, and maybe even which cashier handled the order. Over time, that information starts piling up.
Many retailers never really look at it. They just check the daily revenue number and move on.
Most modern businesses rely on a POS system for businesses to track transactions and store checkout data.
But that checkout data can actually reveal a lot about what’s happening inside a store. Not perfectly. Not always clearly. But it does leave clues. Retailers who begin exploring POS reporting for sales often discover that simple checkout records can quietly highlight patterns they never noticed before.
POS Analytics Explained
POS analytics basically means looking at the data created by your modern point-of-sale system. Every time a product is scanned or added to the cart, the system records something. It might include things like:
- The product name
- How many were sold
- The price
- The exact time of purchase
- The payment method
- Sometimes the employee who completed the sale
At first, the information looks messy. It is usually just rows of numbers in reports. But if you look at it over weeks or months, patterns start appearing. Not dramatic patterns usually. More like small trends.
For example, you might notice that certain drinks sell more after 5 PM. Or that a specific snack sells surprisingly well near the register. Without looking at the data, you might never notice those things.
This is where sales optimization with POS data starts becoming possible, because even small patterns can influence retail decisions.

10 Ways Retail POS Analytics Help Increase Sales in 2026
Smart POS analytics highlights what sells best and where profits grow faster.
1. Most Stores Ignore the Data
This happens a lot. Retailers install a POS system because they need to accept cards and track sales. The analytics section of the system often gets ignored.
There are a few reasons for that.
First, store owners are busy. Running a store already involves inventory, staff schedules, customers, and suppliers.
Second, POS dashboards can look confusing. There are sometimes dozens of reports with charts and numbers that feel overwhelming.
So people check the basics:
- Total sales today
- Total sales this week
- Maybe monthly revenue
And that’s it. But the deeper reports sometimes hide useful insights. Many systems now organize POS reporting for sales into simple dashboards so retailers can understand patterns more easily.
These POS system features help store owners manage sales insights more clearly.
2. The Simple Power of Checkout Data
The data collected at checkout can show things like:
- What products sell the most
- What products barely sell
- When the store is busiest
- Which items do customers buy together
- How discounts affect sales
None of this is revolutionary information. But it is practical. Sometimes store owners assume certain products are popular when they actually are not. Data can correct those assumptions.
Other times, unexpected items turn out to be strong sellers. That kind of discovery can influence decisions about stock and displays.
3. Finding Best-selling Products
One of the easiest POS reports to understand is the “top-selling products” report. Most POS systems generate this automatically.
You might see a list showing:
- Top 10 selling items this week
- Top products this month
- Products generating the most revenue
If you run a cafe, coffee might be at the top, but sometimes the results are surprising.
For example:
- A specific flavor might sell much more than others
- A small accessory item might sell all day steadily
- A seasonal product might suddenly jump in sales
Once retailers notice those trends, they might adjust how those products are displayed. Popular items might get better shelf space.
4. Slow Products Become Visible Too
POS analytics doesn’t only highlight good news. It also reveals slow products. Every store has items that barely move. Sometimes those products sit on shelves for months without anyone realizing how slow they are selling. POS reports can show things like:
- Products with very low sales
- Inventory sitting too long
- Items that rarely appear in transactions
Once that becomes visible, store owners might respond by:
- Discounting the product
- Bundling it with another item
- Reducing future orders
- Removing it from shelves entirely
Without analytics, this kind of issue might go unnoticed. Retailers often start sales optimization with POS data simply by identifying and fixing these slow-moving products.
5. Timing Matters More Than You Think
Another interesting thing POS systems record is time. Every transaction has a timestamp. Over time, that creates a picture of when the store is busiest.
Sometimes retailers assume they know their busy hours, but the data shows something slightly different.
Examples might include:
- Lunch hour spikes in quick-service shops
- Evening rushes after work
- Weekend mornings are unexpectedly busy
6. Products that Sell Together
Another interesting thing checkout data can show is product combinations. Sometimes, customers buy certain items together frequently.
For example:
- Chips with soft drinks
- Phone cases with screen protectors
- Notebooks with pens
POS analytics can reveal these patterns. Retailers sometimes respond by placing those products near each other or offering bundle deals. It’s a simple strategy, but it can increase average purchase value.
7. Discounts and Promotions
Retail stores run promotions constantly. Seasonal sales, holiday discounts, clearance events. These are common. POS reports can help evaluate whether those promotions worked. You might notice things like:
- A spike in product sales during a discount
- Increased store traffic during a sale week
- Certain items are selling faster than expected
But promotions do not always increase profits. Sometimes discounts reduce margins without increasing overall sales much. Looking at checkout data can help retailers understand whether promotions are worth repeating.
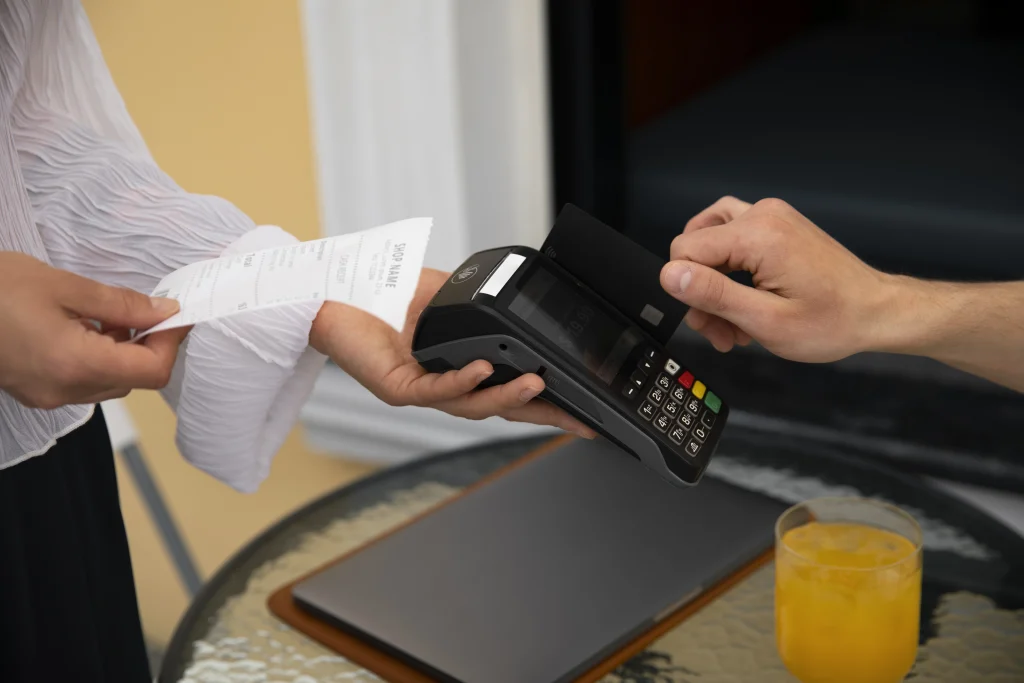
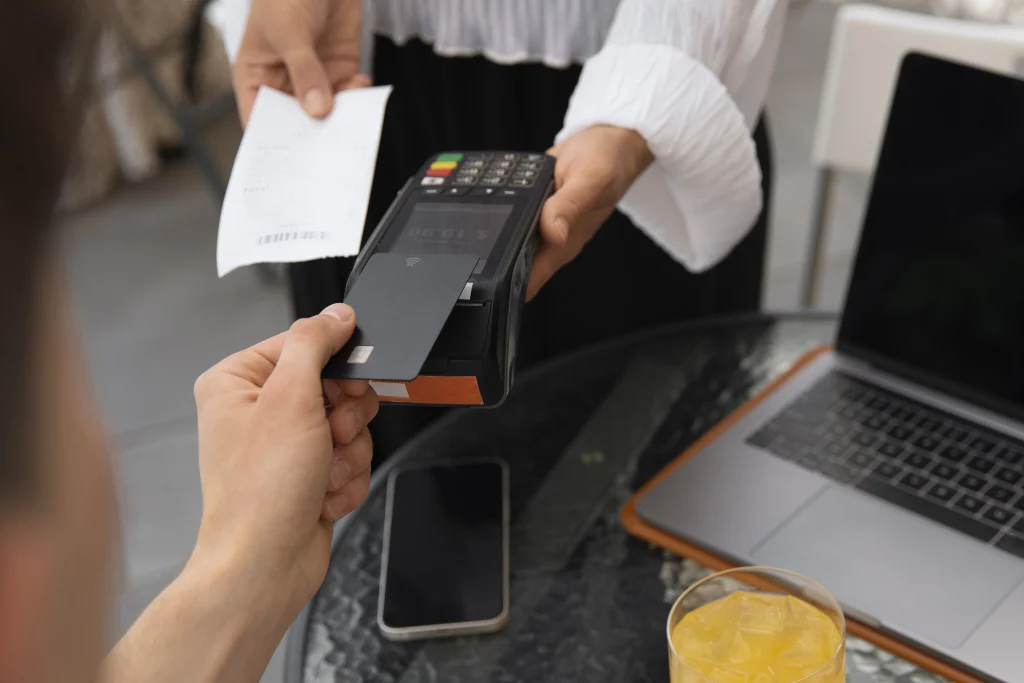
8. Payment Trends
POS systems also show how customers pay. You may start noticing patterns such as:
- More contactless payments
- Declining cash transactions
- Increased mobile wallet use
These trends can influence checkout setup. For example, a store noticing many mobile payments might prioritize faster contactless readers. It’s not a huge change, but it improves the checkout experience.
9. Inventory Planning
Checkout data can also help predict how much stock is needed. Instead of guessing, retailers can look at historical sales.
For example:
- If a product sells about 40 units per week
- If sales spike during certain seasons
- If certain products sell faster during holidays
This helps prevent two common problems:
- Running out of popular products
- Overstocking slow items
Both situations can hurt profits. Analytics helps balance inventory decisions.
10. The Data is Not Perfect
Data always tells you the after results but does not tell why it happened. For example, a product might suddenly sell well because:
- It was placed near the entrance
- A social media trend increased demand
- A nearby competitor ran out of stock
- The weather changed
The numbers show the result, not the cause. Retailers still need observation and experience.
Starting Small with Analytics
Retailers do not need complicated analysis to benefit from POS data. A few simple reports can already provide insights.
For example:
- Weekly product rankings
- Hourly sales patterns
- Inventory movement reports
Checking these once a week can reveal patterns slowly. Many store owners start noticing trends after reviewing a few months of data. It is not instant insight. It builds over time.
POS Analytics is Still Growing
POS systems continue evolving. Newer platforms now offer features like:
- Real-time dashboards
- Automated stock alerts
- Predictive sales estimates
Some systems even suggest inventory orders based on past sales. However, technology cannot replace business judgment completely. Retailers still understand their customers better than software does.
Final Thoughts
Most retailers think of POS systems simply as payment tools. Something to process cards and print receipts. But every transaction quietly creates information.
That information can reveal patterns about product demand, customer behavior, and store activity. POS analytics does not magically increase sales on its own. It simply provides clues. If you need such advanced machines for your business, reach out to Swyft POS.
FAQs
1. What is POS analytics in retail?
POS analytics is the process of analyzing checkout data to understand sales trends, customer behavior, and product performance.
2. How does POS reporting for sales help retailers?
POS reporting for sales helps retailers identify top products, slow inventory, peak hours, and trends that influence smarter decisions.
3. Can sales optimization with POS data really increase revenue?
Yes, sales optimization with POS data improves inventory planning, promotions, and product placement, which can gradually increase store revenue.
4. How often should retailers review POS analytics reports?
Retailers should review weekly and monthly reports to spot patterns, adjust stock levels, and refine pricing strategies.
5. Is POS analytics useful for small retail stores?
Yes, even small stores benefit from POS analytics by understanding customer habits and improving inventory and sales decisions.